2023-2024 Competition 1 (Nov 15 - Nov 29)
Welcome to our first competition of the school year! This a classification competition to predict which passengers were more likely to survive the Titanic.
The dataset, along with starter code, can be found in these slides (meeting 6).
- train.csv contains the training data.
- test.csv contains the testing data. You are required to test your model on this data and generate a submission file.
Leaderboard
| Position | Name(s) | Accuracy (percent correct) |
|---|---|---|
| 1 | Lawrence Song | 77.99% |
| 2 | Tanav Kalidindi | 77.511% |
| 3 | Nirav Eati | 76.315% |
| 4 (tie) | Nathan Pharris | 66.028% |
| 4 (tie) | Raymond Ge | 66.028% |
| 4 (tie) | Anuj Pannala | 66.028% |
| 4 (tie) | Alex Liu | 66.028% |
| 4 (tie) | Henry D'Ambrosio | 66.028% |
| 4 (tie) | Prayag Suthar | 66.028% |
| 4 (tie) | Jacob Iwaniw | 66.028% |
| 4 (tie) | Vivek Mav | 66.028% |
Evaluation: The metric used is acccuracy, which is simply the number of correct predictions divided by the total number of predictions (i.e., the percent of predictions that were correct).
Submission:
Your program must predict on the testing data and generate a CSV (
comma-separated values) file with the predictions. Use this form to submit your code and submission file. We will run your code on the testing data and will use the generated CSV file to determine the score.
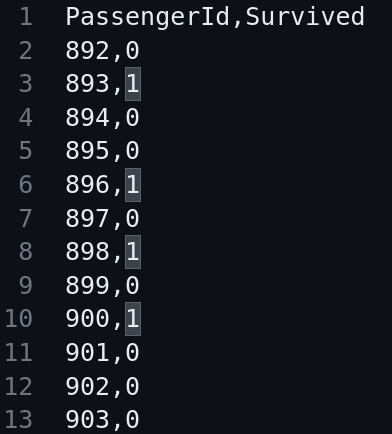
Sample csv file with predictions
Starter Code can be found in these slides (meeting 6).